> ## Documentation Index
> Fetch the complete documentation index at: https://elementary-devin-1782754750-bigquery-permissions-docs.mintlify.site/llms.txt
> Use this file to discover all available pages before exploring further.
# Managing Test Coverage
There are two ways to manage test coverage in Elementary:
* **Test Coverage screen** — a visual overview of coverage across all your assets and dimensions, with the ability to add missing tests directly from the UI
* **[Test Recommendation Agent](/cloud/ai-agents/test-recommendation-agent)** — analyzes your pipeline, lineage, and existing tests to suggest what’s missing and where, then adds tests on your behalf
Use the screen to get a high-level picture and act on gaps in bulk. Use the agent when you want coverage recommendations driven by context — patterns, lineage, and asset criticality.
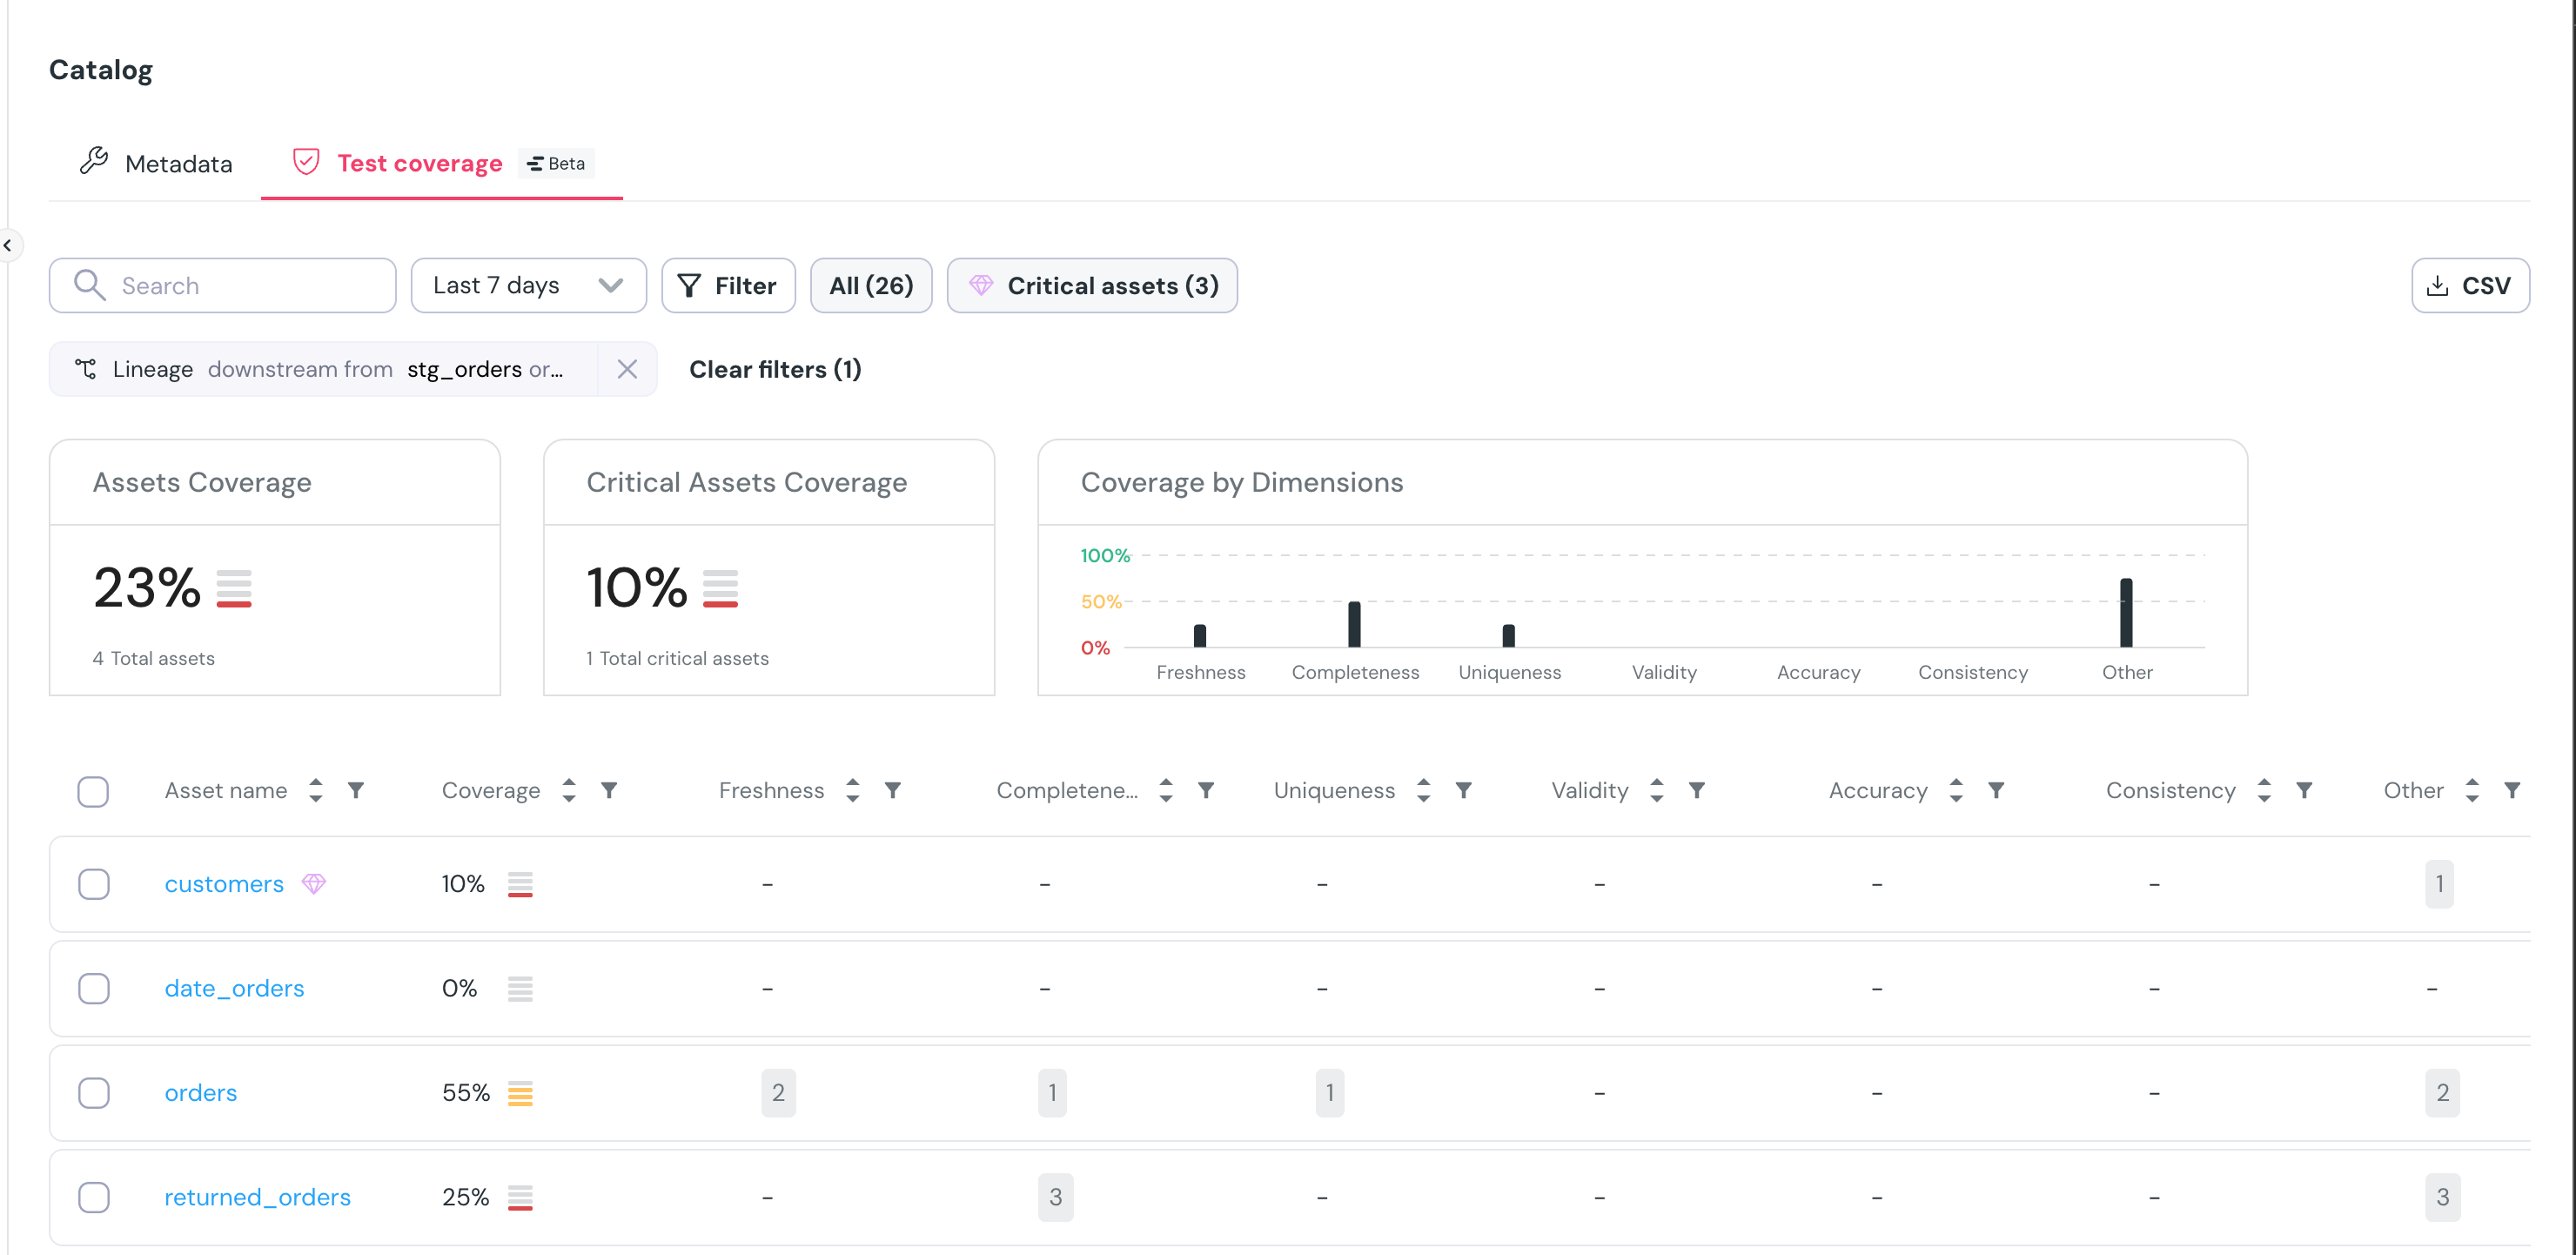
The **Test Coverage screen** in the Elementary Cloud [catalog](/cloud/features/collaboration-and-communication/catalog) gives you a full picture of your data quality coverage across assets and dimensions.
## What It Shows
Each asset is evaluated across **seven data quality dimensions**:
* **Freshness**
* **Completeness**
* **Uniqueness**
* **Validity**
* **Accuracy**
* **Consistency**
* **Other**
For each asset, you’ll see:
* **Which dimensions are covered** by existing tests
* **Where coverage is missing**
* [A **coverage score** between **0–100%**](/cloud/features/data-tests/test-coverage-screen#how-coverage-calculation-works).
* **Links to test results**
## What You Can Do from This Screen
From the Test Coverage screen, you can:
* Filters by asset properties, test name, critical assets, and coverage ranges.
* **Select multiple assets and seamlessly add your missing tests with just a few clicks**
* **Jump directly to any asset in the catalog to review its details**
* Gain insight into gaps by grouping assets across dimensions like domain, pipeline, tag, or owner—making weak spots easy to identify. (Coming soon)
* Export the results to CSV
## How Coverage Calculation Works
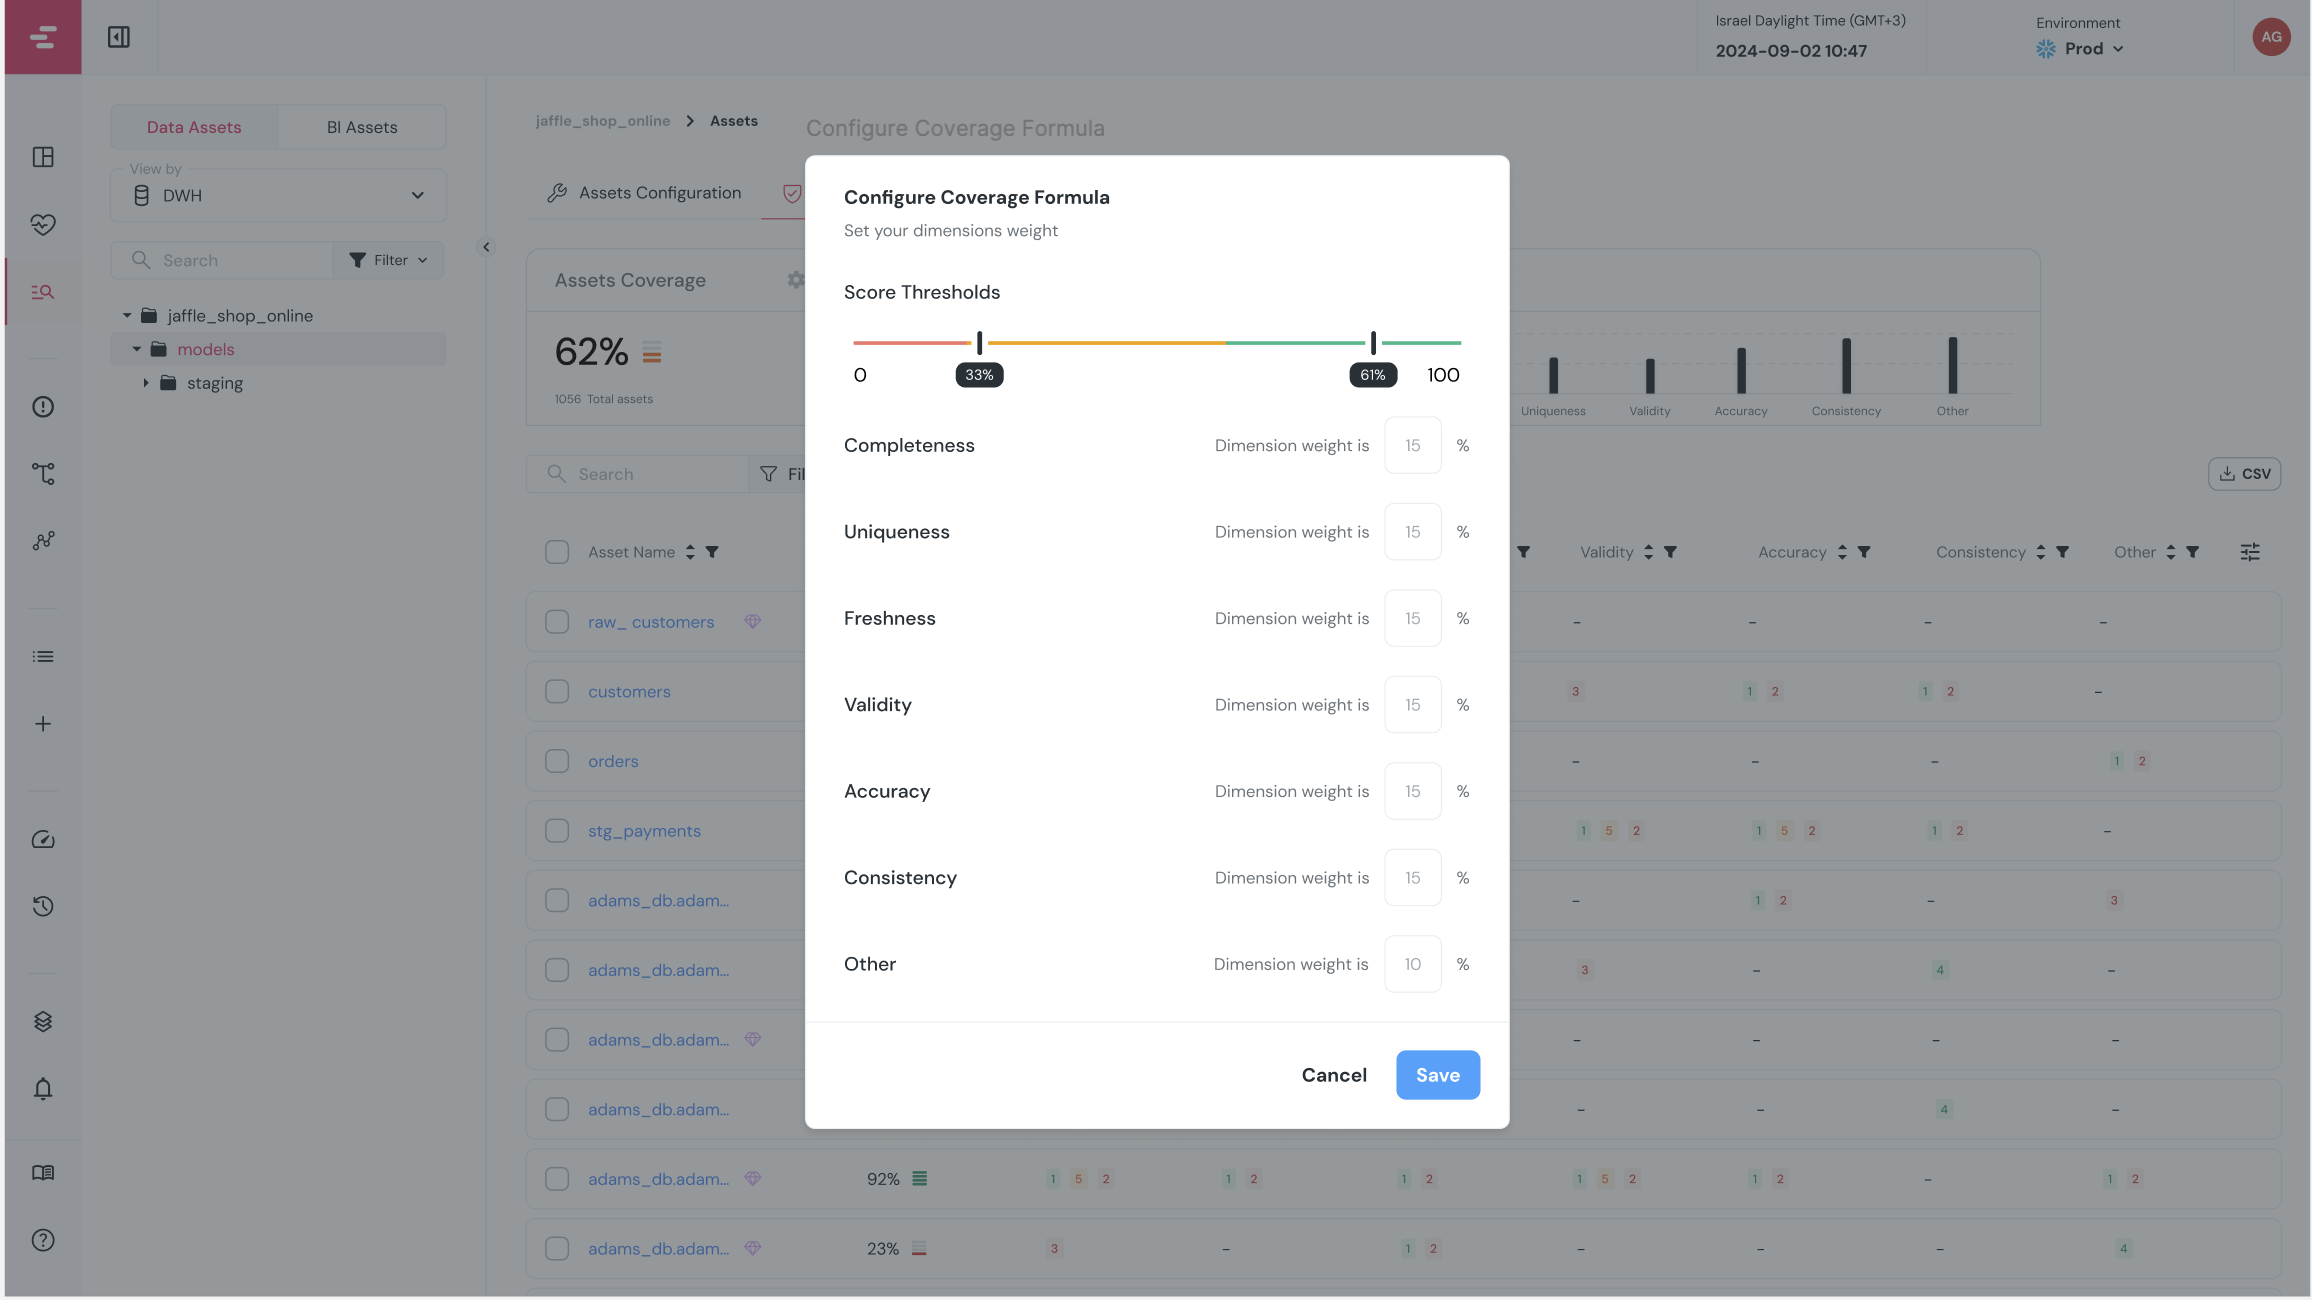
The **test coverage score** is calculated based on **7 dimensions of data quality**.
The first **6 core dimensions** each contribute **15%** to the total score. The **7th dimension**, labeled **“Other,”** accounts for the remaining **10%** and is primarily used for **business logic tests** that don’t align directly with any specific core dimension.
### Upcoming Features
* **Customizable Weights:**
You’ll soon be able to tailor the weighting of each dimension to align with your organization’s unique priorities and testing standards.
* **Custom Coverage Rules:**
Define your own coverage criteria to better identify tables that do not meet your internal standards. This will make it easier to spot gaps and maintain consistent data quality practices.
## Test Recommendation AI Agent
Alongside the Test Coverage screen, you can also use our [**Test Recommendation Agent**](https://docs.elementary-data.com/cloud/ai-agents/test-recommendation-agent) to help you improve test coverage.
Together, the coverage screen and the agent give you visibility and guidance to focus your efforts where they’ll have the most impact.